
The Real Problems With the ICT Trading Strategy
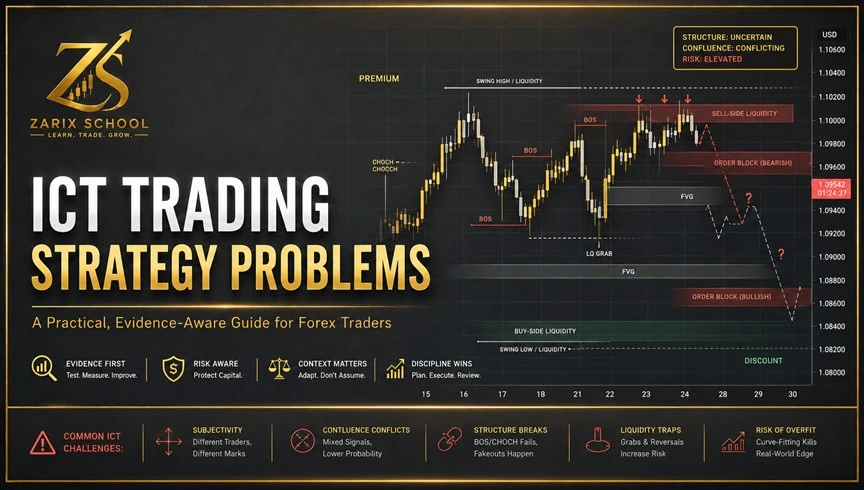
ICT trading concepts often look remarkably clear on a completed chart. Price takes liquidity, breaks structure, creates a Fair Value Gap and then returns to an Order Block before moving toward the expected target.
When the whole move is already visible, the explanation can seem precise and convincing.
The experience is very different in live trading.
Before the move happens, the chart may contain several liquidity levels, multiple Fair Value Gaps, conflicting Order Blocks and different interpretations of market structure. The trader has to decide which one matters without knowing what price will do next.
This is where many of the weaknesses in the ICT trading strategy become visible. The main difficulty is not learning the terminology. It is applying the concepts consistently, objectively and in real time.
ICT, or Inner Circle Trader, offers a broad framework built around liquidity, market structure, institutional order flow and price imbalances. Some of these ideas can be useful for describing market behaviour. However, the framework also contains important gaps that make it difficult to define, test and reproduce.
This article examines those problems without attempting to fix, simplify or defend the system.
ICT Concepts Depend Heavily on Interpretation
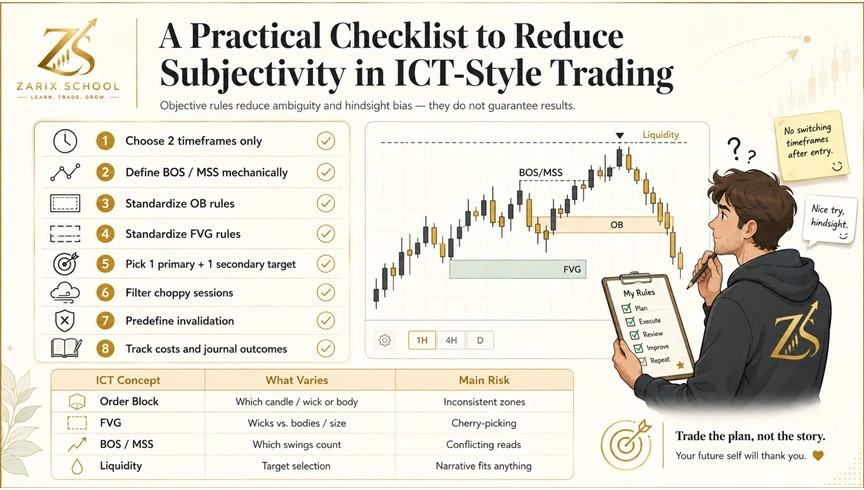
The most obvious problem with ICT is subjectivity. Two traders can analyse the same chart, use the same terminology and still reach completely different conclusions.
Order Blocks are a good example.
An Order Block is usually described as the last bullish or bearish candle before a strong move that breaks market structure. That definition sounds clear until several candles appear to qualify.
The trader then has to decide:
- Which candle represents the actual Order Block?
- Should the zone include the wick or only the candle body?
- Does the zone begin at the open, the midpoint or the full candle range?
- Is the Order Block still valid after a partial return?
- How much penetration counts as mitigation?
- Does a lower-timeframe Order Block matter more than a higher-timeframe imbalance?
There is no single mechanical answer followed by every ICT trader.
The same problem affects Fair Value Gaps, liquidity sweeps, displacement and Market Structure Shifts. Each concept has a general definition, but the exact application often changes between traders, timeframes and educational sources.
This means ICT can appear rule-based while still depending heavily on personal judgement.
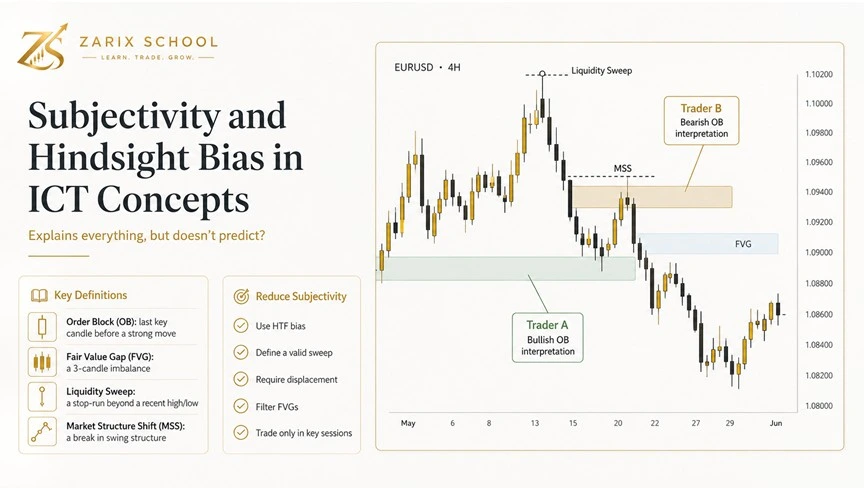
That judgement is not always visible in chart examples. The final screenshot usually shows one clean setup, but it does not show the many alternative zones and signals that were available before the move began.
ICT Setups Look Much Cleaner in Hindsight
Completed charts make ICT concepts easier to identify than they are during live market conditions.
Once price has reversed, the relevant liquidity sweep becomes obvious. Once the market has moved higher, the bullish Order Block appears important. Once a Fair Value Gap produces a reaction, it can be highlighted as the key imbalance.
Before the reaction occurs, none of this is certain.
A live chart may contain three or four Fair Value Gaps within the same price leg. Several swing highs may qualify as buy-side liquidity. Multiple bearish candles may look like valid Order Blocks.
The trader must select one interpretation while all outcomes are still possible.
After the move is complete, failed zones tend to disappear from the explanation. The level that worked receives attention, while the levels that failed are rarely discussed.
Description is not the same as prediction. A model can explain a completed move without having identified it clearly in advance.
This creates a serious hindsight problem. The system often appears more accurate in educational examples than it feels in live trading because the outcome has already revealed which interpretation was correct.
Market Structure Is Less Objective Than It Appears
Market structure is one of the foundations of ICT trading, but it is also one of its most inconsistent areas.
Terms such as Break of Structure, Market Structure Shift, Change of Character, internal structure and external structure are widely used. Their exact definitions, however, are not always consistent.
The main problem is swing selection.
Most charts contain several possible swing highs and swing lows. A break may look important on the one-minute chart while remaining insignificant on the five-minute or hourly chart.
This creates several unresolved questions:
- Which swing point controls the current structure?
- Does a wick through the level count as a break?
- Must the candle close beyond the swing?
- How much displacement is required?
- When does internal structure become external structure?
- Which timeframe has priority when signals conflict?
Different ICT traders answer these questions differently.
One trader may see a confirmed bullish Market Structure Shift. Another may view the same move as a minor internal retracement inside a bearish trend.
Both interpretations can use ICT terminology and both can sound reasonable.
The framework therefore does not always produce one clear market reading. It often produces several possible narratives, with the trader choosing which one to follow.
Liquidity Can Explain Almost Any Price Movement
Liquidity is central to ICT analysis. Previous highs, previous lows, equal highs, equal lows, session extremes, trendline stops and internal swing points may all be treated as liquidity pools.
The difficulty is that a normal chart contains many of these levels at the same time.
Price may move toward one pool while ignoring several others. If the expected level is not reached, the market can often be reinterpreted as targeting a different source of liquidity.
This makes the concept difficult to disprove.
When price moves above a high and reverses, the move may be labelled a liquidity sweep. If price continues higher, it may be labelled a liquidity run. When price falls, it may be targeting sell-side liquidity. When it rises, it may be seeking buy-side liquidity.
Each possible outcome can be explained using the same general idea.
This gives the liquidity narrative enormous flexibility, but that flexibility creates a testing problem. A theory becomes difficult to evaluate when nearly every outcome can be fitted into it after the fact.
The issue is not that liquidity does not exist. Markets clearly need counterparties and orders to transact. The gap lies between that general market reality and the precise claim that a particular high or low was deliberately targeted for a specific institutional reason.
Fair Value Gaps Appear Too Often to Be Clear Signals
Fair Value Gaps are among the most recognisable ICT concepts. They are generally described as three-candle imbalances created when price moves quickly and leaves an inefficient area between candles.
The problem is frequency.
Fair Value Gaps appear constantly, especially on lower timeframes. A strong intraday move may create several gaps within a few minutes.
Some gaps fill immediately. Some receive a partial reaction. Some remain open for hours or days. Others are ignored completely.
Before price reacts, it is often unclear which gap deserves attention.
ICT traders also disagree about:
- Whether very small Fair Value Gaps are valid
- Whether candle bodies or wicks should define the gap
- Whether partial fills count as mitigation
- Whether price must reach the midpoint
- Whether a gap remains valid after structure changes
- Whether overlapping or nested gaps should be treated separately
The abundance of Fair Value Gaps creates a selection problem. When many imbalances exist, the trader can usually find one near almost any potential entry.
After price reacts, the successful gap looks meaningful. Before the reaction, it is only one possibility among several.
The System Contains Too Many Overlapping Concepts
ICT is not built around one simple setup. It contains a large collection of concepts and models, including:
- Order Blocks
- Fair Value Gaps
- Breakers
- Mitigation Blocks
- Rejection Blocks
- Liquidity Voids
- Balanced Price Ranges
- Optimal Trade Entry
- Premium and Discount
- Judas Swings
- Power of Three
- Market Maker Models
- Silver Bullet setups
- Killzones
- Internal and external liquidity
Each concept can seem understandable when explained separately. The difficulty begins when several of them appear on the same chart.
A bullish Order Block may exist inside a bearish higher-timeframe Fair Value Gap. A liquidity sweep may suggest reversal, while daily structure suggests continuation. Price may be in discount on one range and premium on another.
The system does not always provide a clear hierarchy for resolving these conflicts.
As a trader studies more ICT material, the chart often becomes more complicated rather than more decisive. Additional knowledge creates more possible setups, more possible invalidations and more ways to reinterpret the same price movement.
This can lead to analysis paralysis. The trader sees too many valid-looking scenarios and becomes unable to determine which one has priority.
Higher-Timeframe Bias Can Change With the Narrative
ICT traders often begin with a higher-timeframe bias. In theory, this should provide direction and reduce confusion.
In practice, the higher-timeframe narrative can be flexible.
A trader may use weekly liquidity, daily structure, a four-hour Order Block, the previous day’s high and low, a daily imbalance or a premium-and-discount range to establish bias.
These elements frequently point in different directions.
The weekly chart may look bullish while the daily chart appears bearish. A four-hour zone may support buying, while a larger dealing range places price in premium. A previous high may look like a target, while a nearby bearish imbalance suggests rejection.
When the expected direction fails, the bias can often be updated by selecting another timeframe, another dealing range or another liquidity objective.
This makes the original view difficult to evaluate. A failed bullish bias may later be described as an internal move inside a larger bearish narrative. A bearish expectation may be reframed as a temporary liquidity draw before continuation higher.
The narrative remains flexible enough to survive many contradictory outcomes.
Premium and Discount Depend on the Chosen Range
Premium and discount appear objective because they divide a selected price range around its midpoint.
Prices above the midpoint are considered premium. Prices below it are considered discount.
The arithmetic is simple. Selecting the correct range is not.
A trader may measure:
- A weekly high and low
- The most recent daily swing
- A four-hour impulse leg
- The previous session range
- An internal dealing range
- A larger external dealing range
The same market price can therefore be in premium and discount at the same time, depending on which anchors are selected.
This weakens the concept as an objective filter.
The conclusion often depends less on the current price and more on the range the trader chooses to measure. When several valid ranges exist, premium and discount can support opposite trade ideas.
The Institutional Narrative Is Difficult to Verify
ICT terminology often refers to institutional order flow, smart money, liquidity engineering, market maker models and algorithmic price delivery.
This language creates the impression that the trader can identify the intentions of large financial institutions from a candlestick chart.
That claim is difficult to verify.
Retail traders generally cannot observe the exact positions, objectives or execution logic of major institutions from price action alone.
A move above a previous high may involve stop orders, breakout traders, hedging activity, market-making inventory, news-driven orders or many other participants. The chart does not reveal one confirmed motive.
An Order Block may produce a reaction, but the chart cannot prove that unfilled institutional orders caused it. A Fair Value Gap may reflect rapid order flow, but it does not prove that price must return to rebalance the area.
The explanation may be plausible. Plausibility, however, is not evidence.
The institutional language can create false confidence by presenting an interpretation as if it were an observable market fact.
ICT Is Difficult to Backtest Consistently
A trading model becomes easier to evaluate when different testers can identify the same setups from the same chart data.
ICT struggles with this requirement because many of its most important variables depend on interpretation.
Two traders may disagree about:
- The correct higher-timeframe bias
- The relevant liquidity pool
- The valid Order Block
- The strength of displacement
- The swing that defines structure
- The Fair Value Gap that qualifies for entry
Those differences can produce completely different backtest results.
One tester may record a winning setup that another tester does not recognise. One may reject a losing trade because the displacement was weak. Another may include it because the structure break appeared valid.
The problem becomes more serious when poor results are blamed on incorrect interpretation.
If a backtest loses money, supporters can argue that the tester selected the wrong Order Block, misunderstood liquidity, used the wrong timeframe or failed to identify the correct narrative.
This makes independent verification difficult. The framework can become dependent on the judgement of the person applying it rather than on a clearly reproducible set of rules.
Chart Accuracy Does Not Equal Real Execution
Many ICT setups are built around precise entries, small stop losses and large reward-to-risk ratios.
On a historical chart, this can look impressive. Price touches a narrow Fair Value Gap, reacts immediately and moves several times the size of the stop.
Live execution introduces problems that the chart does not show clearly.
Spreads can widen during market opens, economic announcements and periods of rapid volatility. Limit orders may not fill. Market orders may enter at a worse price. A short wick may trigger the stop before price moves in the expected direction.
A setup may look successful on the chart while the actual trade produces a loss.
The tighter the intended entry and stop, the more significant spread, commission and slippage become.
This creates a gap between theoretical performance and tradable performance. Screenshots often show price levels, but they rarely show realistic execution costs, missed fills or the emotional difficulty of entering during a fast move.
ICT Narratives Can Change After the Original Setup Fails
ICT traders often build a detailed narrative before entering a trade. Price may be expected to sweep liquidity, shift structure, return to an imbalance and move toward an opposing high or low.
When price behaves differently, the narrative can change.
A failed Order Block may become a breaker. A missed target may become inducement. A deeper retracement may be explained through another dealing range. A failed reversal may be reframed as manipulation before continuation.
The terminology gives the trader many ways to preserve the broader theory even when the original setup was wrong.
This can make invalidation psychologically difficult.
Instead of accepting that the analysis failed, the trader may continue adjusting the narrative until it matches the latest price action.
The chart remains explainable, but the explanation is no longer the one used before the trade.
There Is No Widely Accepted Verified Track Record
One of the most common criticisms of ICT is the absence of a widely accepted, independently audited long-term performance record for the system’s creator.
There are many videos, predictions, chart examples, testimonials and individual trade results. These are not the same as a complete trading history that includes every entry, exit, loss, fee, period of drawdown and change in position size.
This matters because ICT is often presented as a detailed explanation of how institutional markets operate.
Without independent verification, it is difficult to separate the strength of the educational narrative from the profitability of the trading method.
Online reports vary widely. Some traders describe strong results, while others report inconsistency, large losing periods or an inability to reproduce the accuracy shown in educational examples.
Testimonials and screenshots cannot resolve this disagreement. Successful traders are more likely to share results, while unsuccessful users often disappear from the discussion.
A winning screenshot also provides no information about the total number of losses, missed trades, abandoned setups or changes made to the rules.
High Win-Rate Claims Are Hard to Evaluate
ICT-related content sometimes includes claims of very high win rates, precise entries and unusually large reward-to-risk ratios.
These claims are difficult to assess because the model is discretionary.
A trader may reject losing setups for reasons that only became clear after the market moved. Another may change timeframes until a valid confirmation appears. Winning trades may be credited to the model, while losing trades are described as execution errors.
This creates selection bias.
Win rate alone also ignores important information:
- Maximum drawdown
- Average losing streak
- Spread and commission
- Slippage
- Missed entries
- Cancelled trades
- Changes in risk
- Subjectively rejected setups
Without those details, a claimed win rate says very little about the reliability or practicality of the strategy.
The Main Gaps in Common ICT Concepts
| ICT Concept | Main Problem | Why It Creates Difficulty |
|---|---|---|
| Order Block | No universal selection rule | Several candles may qualify, while boundaries and invalidation rules differ between traders. |
| Fair Value Gap | Appears too frequently | Many gaps form, but the framework does not objectively identify which one will matter. |
| Liquidity Sweep | Often confirmed only after reversal | A breakout becomes a sweep only when price later moves in the opposite direction. |
| Market Structure Shift | Depends on swing selection | Different timeframes and swing points can produce opposite structural readings. |
| Premium and Discount | Depends on the selected range | The same price can be premium in one range and discount in another. |
| Higher-Timeframe Bias | Can be reinterpreted | Weekly, daily and intraday narratives may conflict or change after the market moves. |
| Killzones | Time does not guarantee setup quality | Traders may force an interpretation because price is inside a preferred session. |
| Institutional Order Flow | Cannot be directly confirmed from candles | Price charts do not reveal the exact motives or positions of major institutions. |
Frequently Asked Questions About ICT Trading Problems
Why is ICT trading considered subjective?
ICT trading is considered subjective because its main concepts do not always have fixed mechanical definitions. Traders can select different Order Blocks, swing points, Fair Value Gaps and liquidity targets on the same chart.
Why do ICT setups look better after the market moves?
The completed move reveals which level produced the reaction. During live trading, the trader must choose between several valid-looking zones without knowing which one will matter.
Is ICT a complete trading system?
ICT is better described as a broad framework of concepts and discretionary trading models. Different traders combine and interpret those concepts in different ways.
Why is ICT difficult to backtest?
ICT is difficult to backtest because variables such as market structure, displacement, liquidity sweeps and valid Order Blocks depend heavily on interpretation. Different testers may record different setups from identical chart data.
Does the ICT trading strategy have a verified track record?
There is no widely recognised, independently audited long-term record that confirms the overall profitability of ICT concepts or every performance claim associated with them.
Final Assessment of the ICT Trading Strategy
The main weakness of ICT is not that every concept is meaningless. Liquidity, market structure and price imbalance can all help traders describe what has happened in the market.
The central problem is the gap between explanation and prediction.
ICT contains flexible definitions, overlapping concepts and narratives that can change as new price action appears. Its setups often look clear on completed charts but become much harder to identify consistently in real time.
Order Blocks, Fair Value Gaps, liquidity sweeps and Market Structure Shifts all depend on choices that different traders make differently. The system also lacks a universally accepted hierarchy for resolving conflicts between timeframes, ranges and concepts.
Because failed trades can often be explained through another ICT idea, the framework is difficult to disprove. This creates serious problems for objective testing, independent verification and consistent execution.
The most important question is therefore not whether ICT terminology can explain a chart after the move.
The more useful question is whether the same interpretation could have been made clearly, consistently and without hindsight before the market moved.
That unresolved gap remains the biggest challenge in the ICT trading strategy.
If you want structured education that emphasizes clarity and testability, Zarix School publishes more guides on market structure, entries, and risk management. Share your questions or experiences in the comments so we can refine this checklist together.